
Trial Enrichment Strategy
Find the responders inside your trial.
Most oncology trials that fail do so on efficacy, not because the drug never works, but because the responders are diluted by patients who were never going to respond. We use geometry to separate them, from tumor gene expression alone.
Trial Enrichment Strategy uses the same geometric method as Responder Atlas, run privately on your cohort's data rather than on public data.
How the engine works
Two capabilities from one geometric substrate.
Our method builds a geometric signature from each patient's tumor gene expression, with no knowledge of treatment outcome. From that signature come two capabilities:
01
Response classification
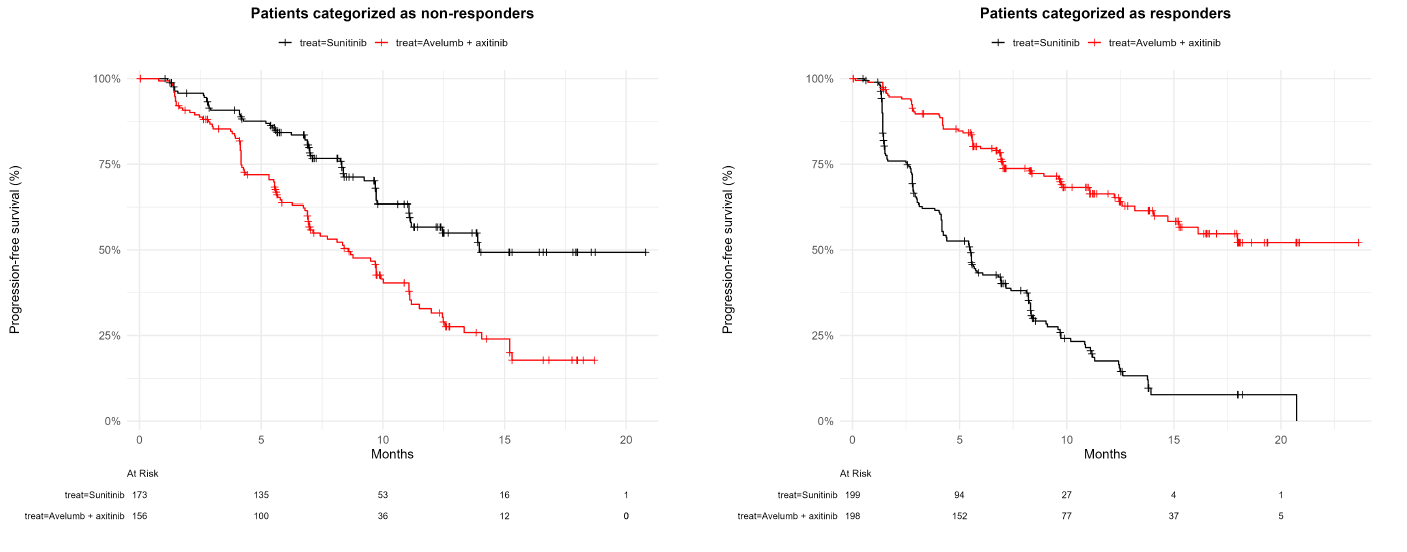
Every patient is labeled a responder or non-responder from expression geometry alone, across censoring and treatment arms. These clean, geometry-derived labels are a strong substrate for identifying candidate biomarkers of response.
02
Trial Enrichment Strategy
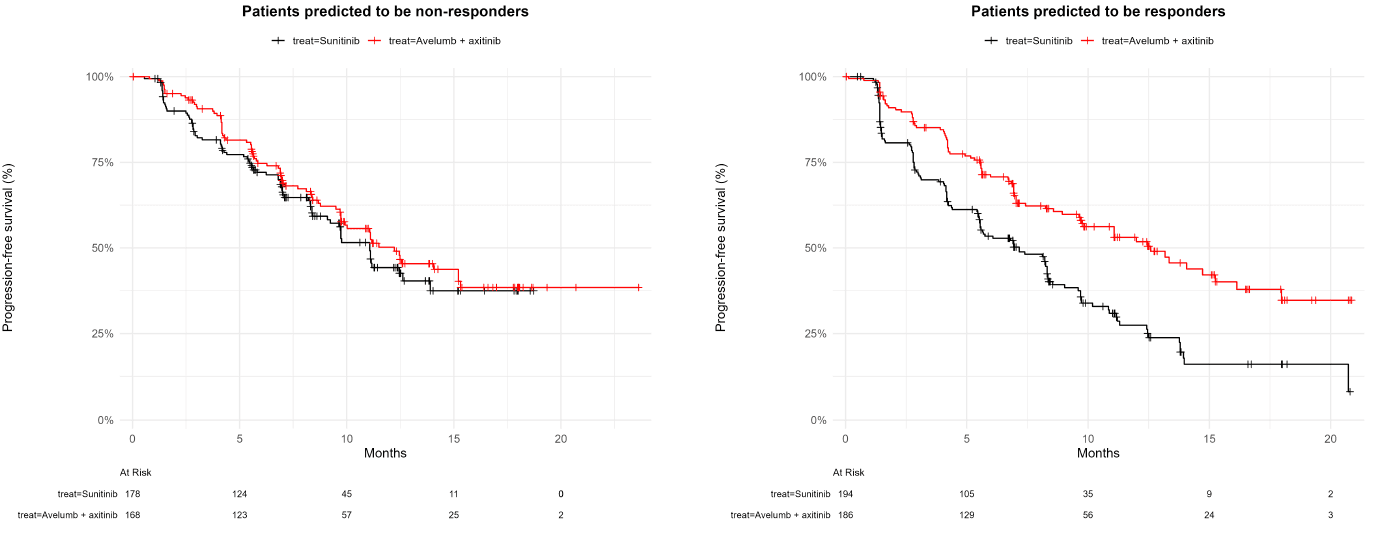
A leave-one-out procedure that predicts stable response subgroups entirely out-of-sample, unbiased by construction. In the JAVELIN Renal 101 trial it recovered response classification at 82.0% accuracy, and the predicted-responder subgroup captured 79.2% of the treatment effect.
The result
JAVELIN Renal 101.
We validated this on the Pfizer JAVELIN Renal 101 trial, avelumab plus axitinib in advanced renal cell carcinoma, using the open-sourced data (n = 726 with gene expression). The out-of-sample predicted-responder group showed roughly four times the treatment effect of predicted non-responders.
82.0%
Out-of-sample accuracy recovering the geometry-based internal classification, entirely by leave-one-out prediction.
79.2%
Share of the total treatment effect concentrated in the predicted-responder subgroup.
Why it's outstanding
Four things that don't normally come together.
- 01
Works where machine learning can't
Finds signal in a few hundred patients across hundreds of thousands of expression features.
- 02
Unbiased by construction
The geometry is built with no input from treatment response, and the prediction is out-of-sample and leave-one-out.
- 03
Classifies everyone
Every patient gets a label, including censored and comparator-arm patients.
- 04
Captures most of the effect
A predicted-responder subgroup carrying roughly 80% of the treatment effect is what changes a trial's enrichment strategy, endpoints, and probability of success.
What it's for
Where trial enrichment moves the needle.
- Phase II enrichment and inclusion criteria.
- New primary or secondary endpoints.
- Post-hoc analysis of failed Phase III trials where a responder subgroup was present but invisible to the original analysis.
- Companion-diagnostic development.
Developed by professors at the Karolinska Institutet and KTH Royal Institute of Technology.
Read the preprint